This is a bit of a long post but hopefully will give you a more detailed understanding of PDB fies and the GAC and the various method to debug assemblies in the GAC.
Since this post is about debugging, Im assuming you have a debug build. There are other builds that use PDB files, read about them
Determining if an assembly is compiled in release or debug mode
1. How Visual studio handles adding references to an assembly in the gac
2. How is the PDB used and can one debug with an assembly in the gac? I have a local pdb sitting next to my reference file, do I need to actually put the pdb in the gac? Isn't there another way? (quick answer, there is another way but some choose the gac)
The easiest method is defined at the very bottom of this article.
How Visual studio handles adding references to an assembly in the gacWhen you click "Add Reference" to a project and get the resulting window.
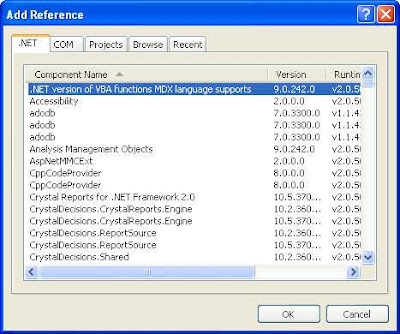
These results ARE NOT from the GAC. Visual Studio has these folders stored at:
HKLM\Software\Microsoft\VisualStudio\X.X\AssemblyFolders
where X.X is a version number.
Here you can see how Infragistics shows up in the list because of the folder added under AssemblyFolders

There is another key which contains more information as well located under HKLM\Software\Microsoft\.NETFramework\AssemblyFolders as shown here:
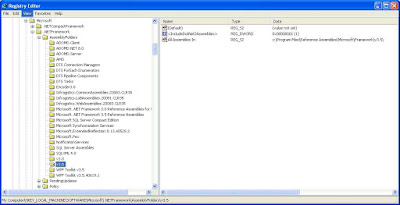
Again, the references window is _not_ looking at the gac, this is fully registry (and hence path, not gac) based. If you want to add your own folders simply follow the directions by ms to update the registry keys as outlined here:
So if you need to add a reference to your own assembly that is in the GAC you can either browse for assembly or add a project reference.
There is something very important to realize here. When you select your item, Visual Studio does check if the assembly you are selecting is ALSO in the GAC. You must have another local copy of that file to reference. What if you don't have it? I lost my file! My dog ate it! This may never ever happen to you but more to increase understanding on this in theory you can go to a command line and make a local copy of this library in most cases.
Follow these steps:
1. open a command line and go to c:\windows\assembly
2. run dir *assemblyname* /s
(that will find the folder in your assembly, or course replacing assemblyname with some portion of your assembly name or just type your whole assembly name)
3. when the results come up go all the way into the assemblyname and then the version folder - you must do this at the command line, there is shell integration with the GAC so you cannot view this folder through explorer.
4. Run the copy command to copy the dll out for instance copy *.* c:\temp
5. Add your reference from the temp folder
How is the PDB used and can one debug with an assembly in the GAC? I have a local PDB sitting next to my reference file, do I need to actually put the PDB in the GAC? Isn't there another way?
You can indeed debug an assembly in the gac and its quite easy. There are several ways to do it, and it depends on your version of Visual Studio and how you want to do this.
First what is the GAC - the GAC is a place for shared libraries. If you develop a component and five applications use it, the GAC is a great place to house that component. You only need to ever update one location - the GAC.
Whats inside the gac?
If you navigate to c:\windows\assembly you will find in explorer you cannot get there in a regular file view because of the shell integration. So, you must view this folder at the command line: dir c:\windows\assembly
Note the results:

GAC Folders
GAC - .net 1.x asemblies
GAC_32 - 32 bit assemblies. If you are on a 64 bit machine you will see a GAC_64 as well. This was new to .net 2
GAC_MSIL  - Images that can run in either 32 or 64 bit
NativeImages* - These are ngen'd images running as native compiled code (rather than intermediate language)
temp/tmp  tmp is used for gac installation and temp is used for the uninstall. At times these folders will contain files that upon a reboot will clean up. Sometimes failed install will leave files here as well.
See more on this subject at:
GAC Assemblies: Install and Uninstall
In order to debug, you need a PDB (program database file) You cannot install a pdb into the gac via gacutil.exe, you can only install an assembly with gacutil. You have two choice here. There are problems with this method which I will describe below
A. Put the pdb in the GAC manually. This will work. I did see a posting that claimed it did not work, it does indeed work, I've done it quite a few times in the past. You can copy it from a command line by something like the following at a command line:
1. cd c:\windows\assembly\gac_msil
2. cd *aPartOfYourAssemblyName*     then using that path:
3. cd C:\WINDOWS\assembly\GAC_MSIL\MyAssembly\1.0.0.0__121ade23gaef410
now copy it into the gac folder by:
4. copy c:\source\MyAssembly\bin\debug\MyAssembly.pdb .
Restart your application and attach the debugger.
Secondly, you can also simply set your build "output path" in visual studio on your project properties -> Build tab to be the specific gac folder. IE instead of doing the manual copy above, just set that gac folder as the build output folder. You will need to install your assembly into the gac first to get the proper folder name, and you want to make sure the version of your assembly isn't changing with each build or.. this just won't work.. so the technique isn't the best.. but it's possible.
There is another problem with this method. If something has your pdb loaded (ie visual studio/w3wp/aspnet) and your assembly is part of a solution that deploys it into the gac using gacutil, you may fail the compile. The reason is, your GAC folder is removed when you update it. If there is a PDB file with a reference to it, fusion cannot remove it when doing the install process.
Then there is the method where you don't need to copy the pdb file.
Configure Visual Studio (versions 2005 and up), to debug code besides "just my code" which is an option under tools->options->debugging->Enable Just My Code. Uncheck this option
Visual Studio will then search the path you gave it to reference your gac library and look for a pdb file. Set the path of your PDB file on the Tools->Options->Debugging->Symbols tab.
What is 'just my code'? Basically this is code that falls under the following criteria:
Not optimized
No Symbols
Assembly has the DebuggerNonUserCodeAttribute
(info from: Sarah Ford: Did you know… what is just your code
Also make sure you have "Suppress JIT Optimizations on module load" to help prevent issues determining "just my code" (ie if its optimized then it will be determined to be not your code)
This can be set on : Tools–>Options->Debugging–>General->Suppress JIT optimization on module load (Managed only)
C. Configure Visual Studio to look to a symbol server. This is a strong method - as you can publish your symbols to a symbol server or to a folder and always have the required version available. For instance, if you need to setup remote debugging against a production release, the proper version pdb files will automatically load once you pull down the required source code. This way requires you to deploy the symbols for a specific version to the symbol server. I will add more steps to this hopefully in the future.
Who hangs onto the pdb? Visual studio and aspnet_wp.exe or w3wp.exe (iis 6+) both will use the pdb. Why aspnet_wp/w3wp you ask? If you've ever seen an error on a webpage with a fill callstack and source code information, then understand these processes will use the .pdb file to properly determine this information.This is only made possible by having a pdb available.
The easiest method available is to simply start debugging and tell visual studio where to find the pdb file.
Select Debug->Windows->Modules once you start debugging (for example attach to aspnet_wp.exe or w3wp.exe)
Here you can see "Symbol Status" shows that it cannot find the symbols. Since this is a Microsoft assembly, I can simply get the symbols from Microsoft by right clicking and selecting "Load Symbols From->Microsoft Symbol Servers"

Here we see Visual Studio contacting Microsoft for the symbols

Once the symbols have loaded you can select "Symbol Load Information" (actually you can do this on any item and you will see the search it did to try to find the symbols, very helpful sometimes in determining why your symbols didn't get loaded)
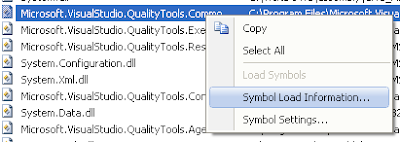
The results:
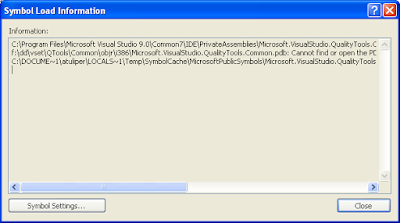
If we click on "Symbol Settings" in the above dialog we see a temporary folder has automatically been chosen to download thhe symbols from Microsoft into:
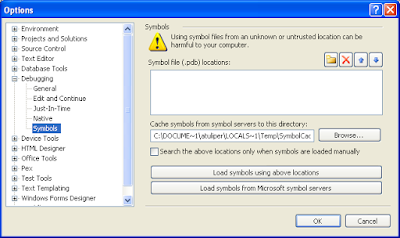
Now if we look at the modules window, it is very clear our symbols have been loaded.

so how do we use this for non-Microsoft assemblies? Very easy. You right click, select 'Load Symbols From->Symbol Path' and enter in the path to your .pdb file. Thats it, and its dynamic so may be the easiest solution for you.
A very great article on various ways to debug. Those who are into remote server management can also find this useful. Thanks for posting.
ReplyDeleteThanks for sharing this very informative article. Those who work in the technical support outsourcing industry will surely find this useful. Cheers!
ReplyDeleteIf you are interested in such articles and wish to explore even more, you can find them here
ReplyDelete